CFT PERFORMANCES

Cumulative Returns Vs Benchmark
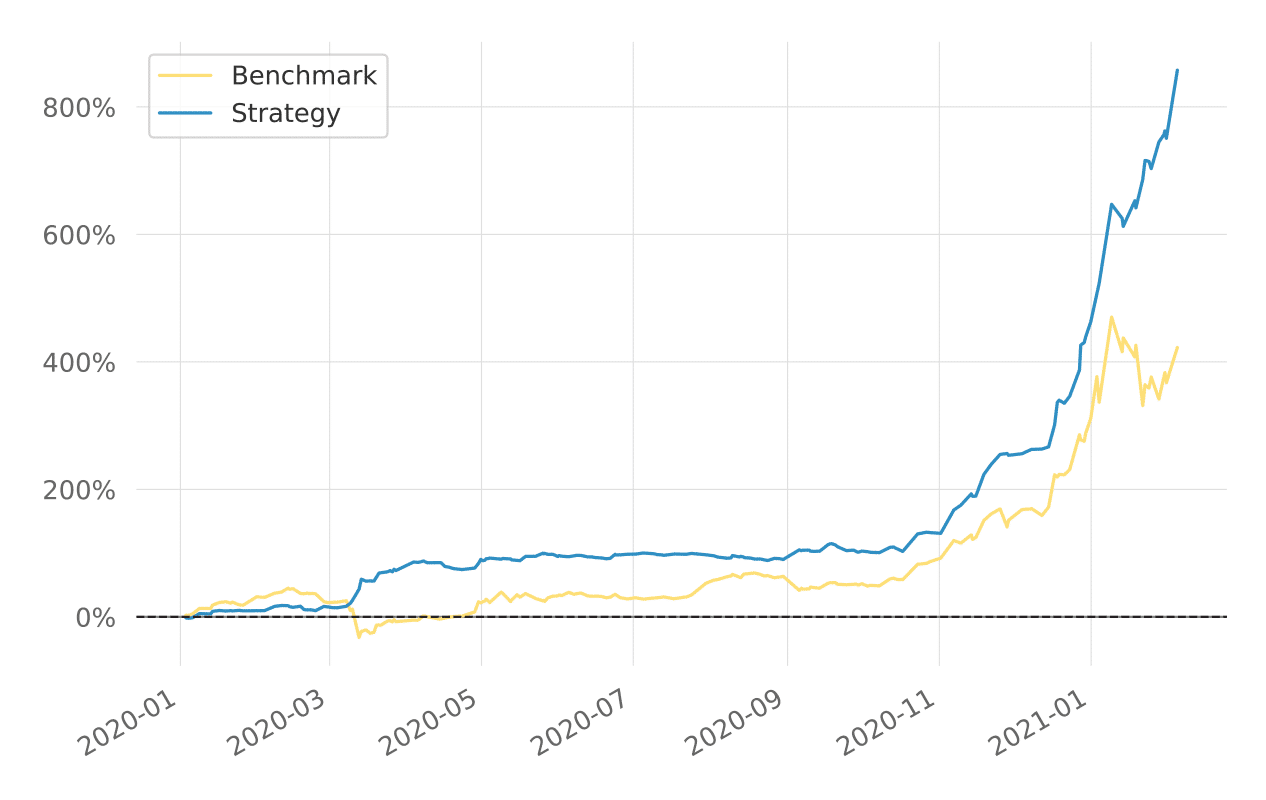
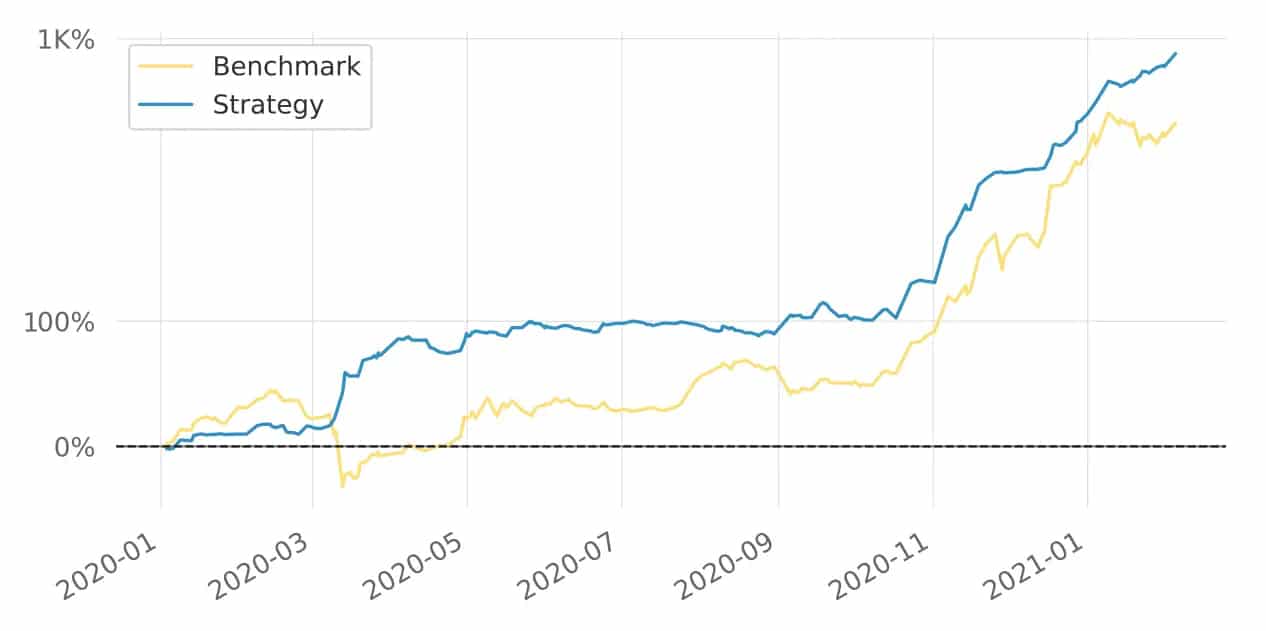
Graphs showing cumulative returns (arithmetic and logarithmic) since Jan 2020 till Feb 2021. Using BTC strategies developed by CFT gave returns over 850% as compared to the benchmark.
Benchmark is the natural price rise of corresponding crypto assets during the specified time period. Whereas a holder of corresponding crypto assets realized a profit of slightly upwards of 400%, an investor enjoyed profits of over 850% using the services of CFT, which is twice than the benchmark.

Cumulative Returns Vs Benchmark (Log Scaled)
An analysis of our performance is apparent from the breakdown of the daily returns our trading strategies have accumulated for our clients. Since January 2020 till February 2021, we have consistently clocked positive daily returns, sometimes as high as 20%.

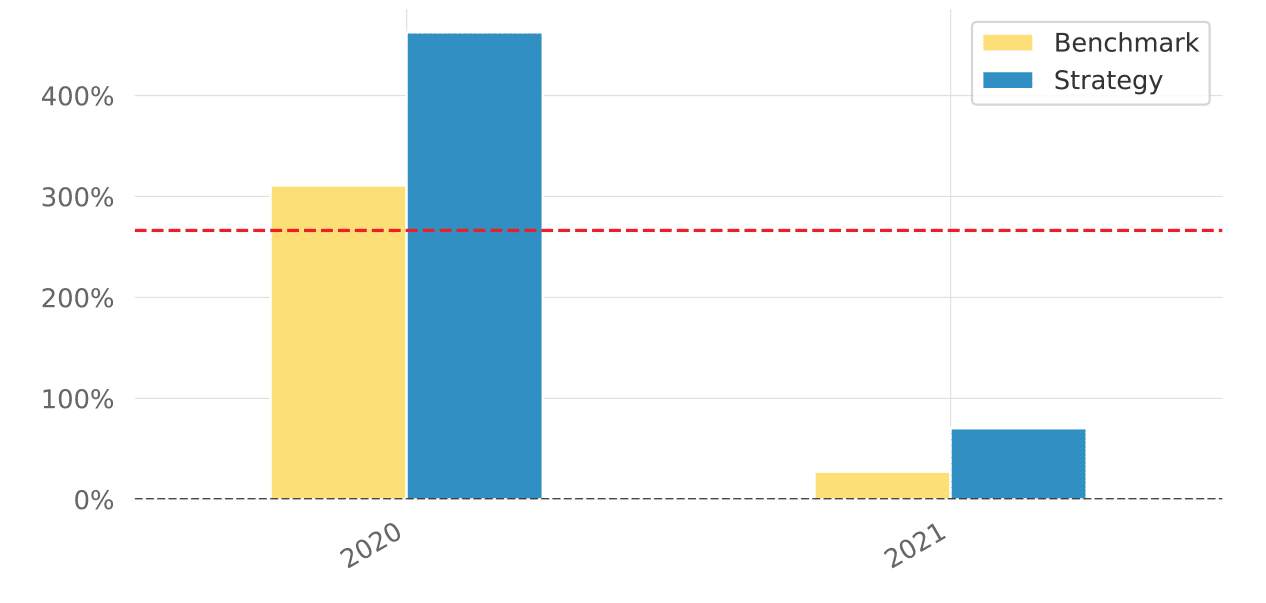
EOY returns vs benchmark
In 2020, saw our strategies compile profits of close to 500% against benchmark. In the financial markets that were badly affected by global economic turmoil forced by the pandemic, lot of interest was renewed by the crypto markets.
In such a scenario, our strategies helped our investors make great profits with minimum risks.
GET THE FULL REPORT
Access the complete information about CFT’s performances.
